
CHAIONE
Predicting the Lifespan of Aboveground Storage Tanks: A Proof of Concept
Chai One| Product designer | 2023
This project served as a proof of concept to demonstrate the capabilities of a calculator designed to estimate the lifespan of Aboveground Storage Tanks. It was aimed at a company in the energy sector that desired to understand and predict the longevity of their tanks.
The project is structured into four levels of information and includes the process to add information to be calculated.

Context
ABOUT CHAI ONE
ChaiOne specializes in delivering solutions for complex problems to industries not well touched for UX. Their partners are in the industry of energy, steel and construction. For this project, an energy transportation company in Canada was looking for a way to prolong the longevity of their Aboveground Storage Tanks (AST).
I was tasked to design a proof of concept aimed to demonstrate the possibility and practicality of developing a corrosion prediction calculator specifically designed for the company.
Challenge
Companies operating in the energy transportation sector, tasked with the storage and transportation of oil and natural gas, undergo periodic inspections for Aboveground Storage Tanks (AST) to assess the risk of corrosion. During each inspection, the liquid contents are transferred, and the tank remains inactive throughout the inspection period and until the analysis of sample results is completed. Post-analysis, the company is provided with detailed recommendations designed to improve the longevity of the ASTs.
Recognizing the substantial costs associated with this process, reaching up to 1M or more, a company reached ChaiOne to seek ways to optimize expenses while upholding safety standards and finding ways to prolong the longevity of their AST. After a study period, ChaiOne viewed an opportunity and put together advanced algorithms and data analysis techniques to provide accurate and reliable predictions regarding the occurrence and severity of corrosion in Aboveground Storage Tanks (ATS).
The main goal of this project was to showcase the capabilities of the calculator in terms of predicting the lifespan of each tank, optimizing maintenance schedules, reducing downtime, and ultimately saving costs.
Final solution
In the final solution, I've implemented both a map view and a list view. The map view displays tanks at their actual locations, color-coded to indicate their risk levels: green for low risk, yellow for medium risk, and red for high risk. This allows users to quickly assess the risk status of each tank.
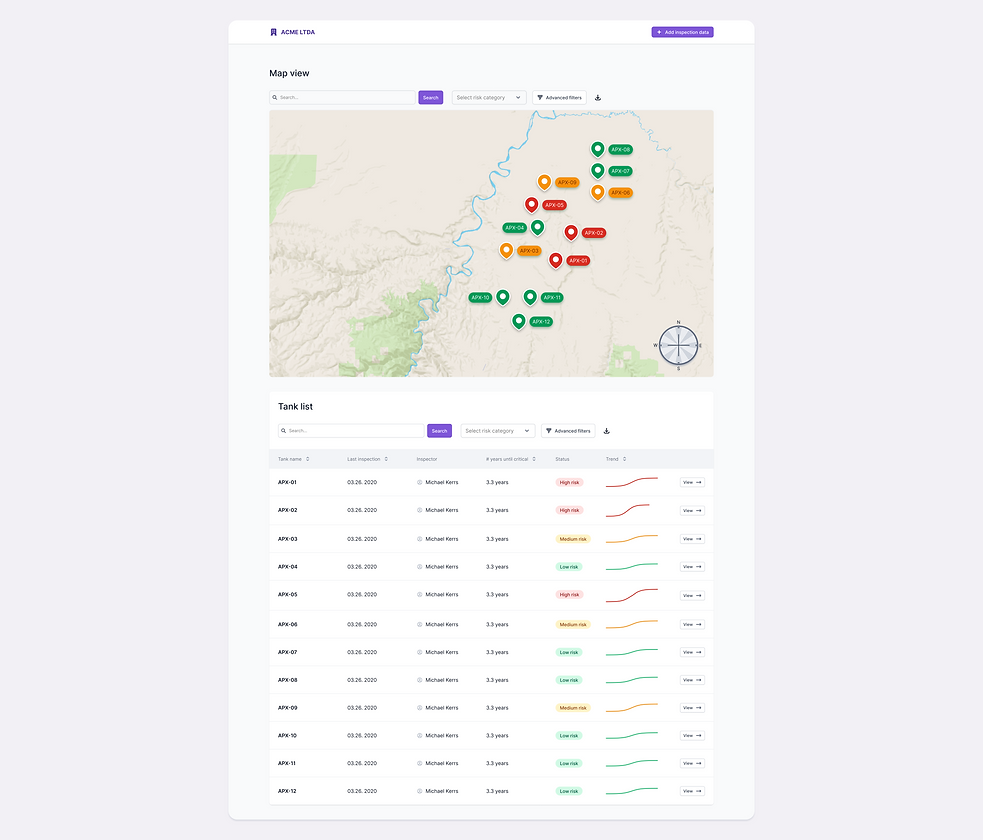
The list view offers detailed information, including the date of the last inspection, the inspector's name, a prediction of the time until the tank reaches a critical state, its current status, and a trend graph illustrating changes over the years.

On the tank's dedicated page, users can explore detailed data for a specific tank. This includes all past inspections, their results, analyses conducted, the number of samples analyzed, and the projected date for the next inspection.

Users can also select a particular inspection to review the results for each sample analyzed.

Furthermore, for a detailed analysis, users can examine data for a specific sample from a tank. This section displays measurements for each parameter alongside a consolidated result for all parameters.

Approach
When I came in to work on this project, there was a month available to do the proof of concept. The conversations with the company in the energy sector had already taken place, the studies were already done and the calculator was already working. The part required was how it would work and how it would behave to the final users.
The first thing I did was to go through the documents the company had put together about the project. There was a person from the product team and a person from the data team available to answer my questions and give feedback on the work. This was a different experience to me where the "clients" were not the final user, but the company that hired me. So I had limited information on the project and could only rely on the documentation and their feedback.

I put together a user flow to see if it was matching with the overall goal of the project. After it was approved, I started drawing a very low fidelity prototype.I chose to start with drawings because of the limited time I had available and because it would speed up the cycle of feedback-iteration.


Along with the iteration process, some changes were made to fit the timeline and the context the system would be used. When a tank is going through an inspection, inspectors go around with sheets of paper with a template and the person needs to identify in which part of the tank the samples were taken from. The tank is split in parts and numbered. The samples get analysed and the results are written into paper. The input of the number are currently done manually, so one idea to speed up this process was to scan the papers and identify the entries. There is also the option to continue entering manually.
I didn't have any restrictions or requirements regarding colors and typography as it was just a concept of proof it didn't have to follow any company rules or pre-existing design system.
Takeaways
This experience was unique for me as the direct clients were not the end-users, but rather the company that contracted me. With limited access to project details, I relied heavily on the documentation provided and feedback from Chai One.
The project received approval from Chai One, who also presented it to their client. The successful completion of this project led to its feature as a case study on Chai One's website.